Some people on Twitter interpreted the statement: “Equilibrium global warming including slow feedbacks for today’s human-made greenhouse gas (GHG) climate forcing (4.1 W/m2) is 10°C, reduced to 8°C by today’s aerosols” in our draft paper “Global Warming in the Pipeline” as indicating that the world is committed to warming of 10°C. The word “committed” or “commit” does not appear in our paper. If it had, it would have been in a statement such as “the world needs to commit to global cooling of about 1°C for the sake of young people and future generations.”
Equilibrium warming is a useful concept employed for more than a century, e.g., in the studies by Arrhenius in the 1890s and Charney in the 1970s. Equilibrium response is the global temperature change after the climate system restores energy balance following imposition of a climate forcing. One merit of our analysis of Cenozoic (past 66 million years) climate is that it reveals that the present human-made GHG (greenhouse gas) forcing is already greater than the GHG forcing at the transition from a nearly unglaciated Antarctica to a glaciated continent. Yes, if we leave atmospheric composition as it is today, sea level will eventually rise about 60 m (200 feet). Of course, none of us would be there to see it. However, it’s not the new equilibrium at +200 feet that’s of most concern, it’s the chaos that ensues once ice sheet collapse begins in earnest.
That chaos was the topic of our paper[1] “Ice Melt, Sea Level Rise and Superstorms,” which was blackballed by IPCC (Intergovernmental Panel on Climate Change). In that paper, we conclude that continuation of GHG emissions along the path that the world is on will lead to shutdown of the overturning (North Atlantic and Southern Ocean) circulations this century and sea level rise of several meters on a time scale of 50-150 years. As yet, little has changed to get us off that path. You would not know that from the communications of the United Nations COPs (Conferences of the Parties) and their scientific advisory body, the IPCC. Projected global warmings continually rachet down as countries agree to more ambitious goals for future emission reductions. If you take those plans plus $2.75 you can get a ride on New York City’s subway (which, BTW, is safe and efficient, albeit ancient – New York City is again a good place to visit).
Physics is a description of the real world. So, climate science should be focused on data. That’s the way science is supposed to work. However, IPCC is focused on models. Not just global climate models (GCMs), but models that feed the models, e.g., Integrated Assessment Models (IAMs) that provide scenarios for future GHG levels. These models are useful and even necessary for analysis of the complex climate system, but sometimes the models contain hocus-pocus. As we mention in our current paper, they can assume, in effect, that “a miracle will occur.” So, the models need to be continually checked against the real world.
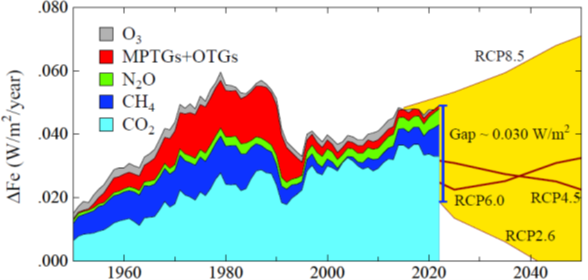
Our research is focused on real world data and comparison with models, with the hope of gaining insights about how the climate system works and where the real world is headed. Fig. 28 (lead figure) shows the annual increase of GHG climate forcing based on real world data (which, BTW, is continually updated and made available by Ed Dlugokencky of the NOAA Earth System Research Laboratory; Ed is an unsung hero in the climate change story). Specifically, Fig. 28 compares the real-world growth rate of GHG forcing with the RCP2.6 scenario, which is used in IPCC’s AR5 report as a scenario that would limit global warming to about 2°C. Figure 28 shows that an enormous gap has opened between the real world and RCP2.6. The “miracle” in RCP2.6 is largely an assumption of negative emissions via power plants that burn biofuels, capturing and sequestering the CO2. Also beware of nations promising “net zero” emissions without defining what they mean. As discussed in our paper, the present policy approach is not working and it is not likely to work. For example, the cost to close the gap in Fig. 28 via carbon capture and storage is estimated as $3.4-7.0 trillion per year – that’s the annual, growing cost. That miracle is not likely to happen.
There’s no time to get involved in Twitter wars. It’s disappointing that scientists who once contributed to research progress, but now enjoy twittering, do not correct a nonscientist’s assumption that equilibrium warming = committed warming but instead allow the misconception to persist and then use it to insist that we are “wrong” in our assessment. Further, their claim that current scientific literature points to eventual global warming being kept “well below 2°C” as being consistent with real world trends and policies is egregious, an uncritical acceptance of models and the assumptions that went into them.
|